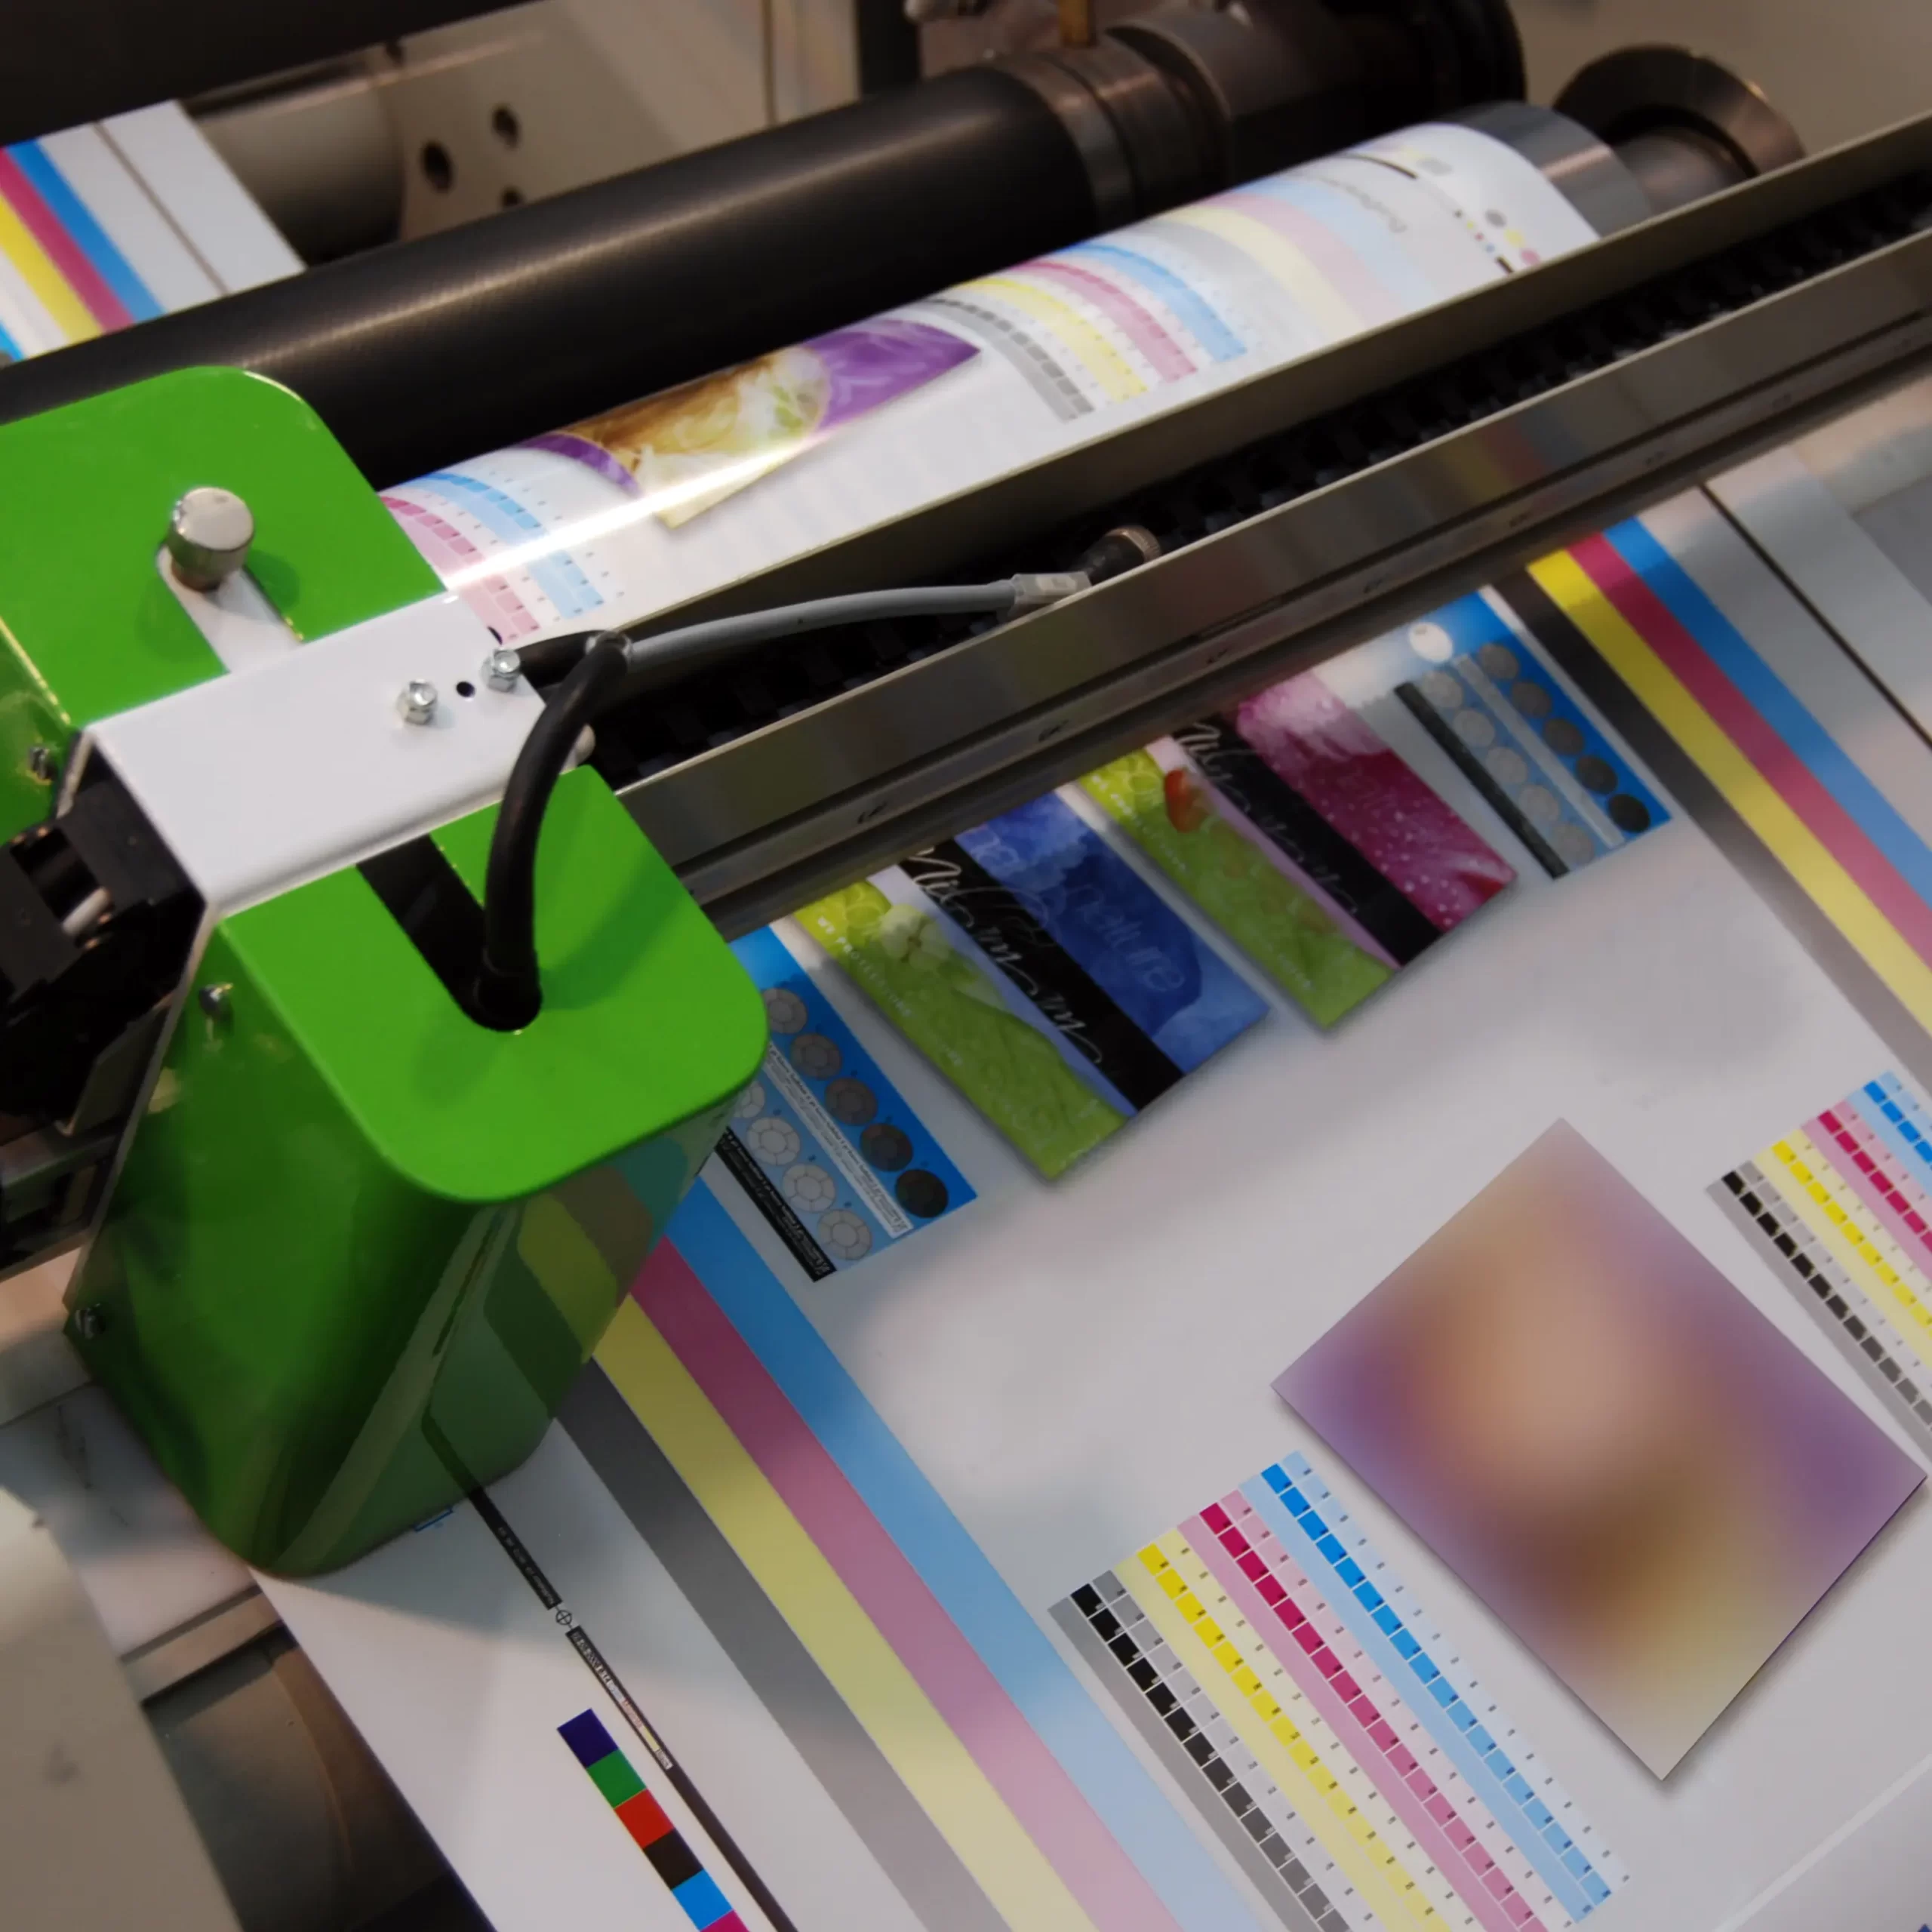
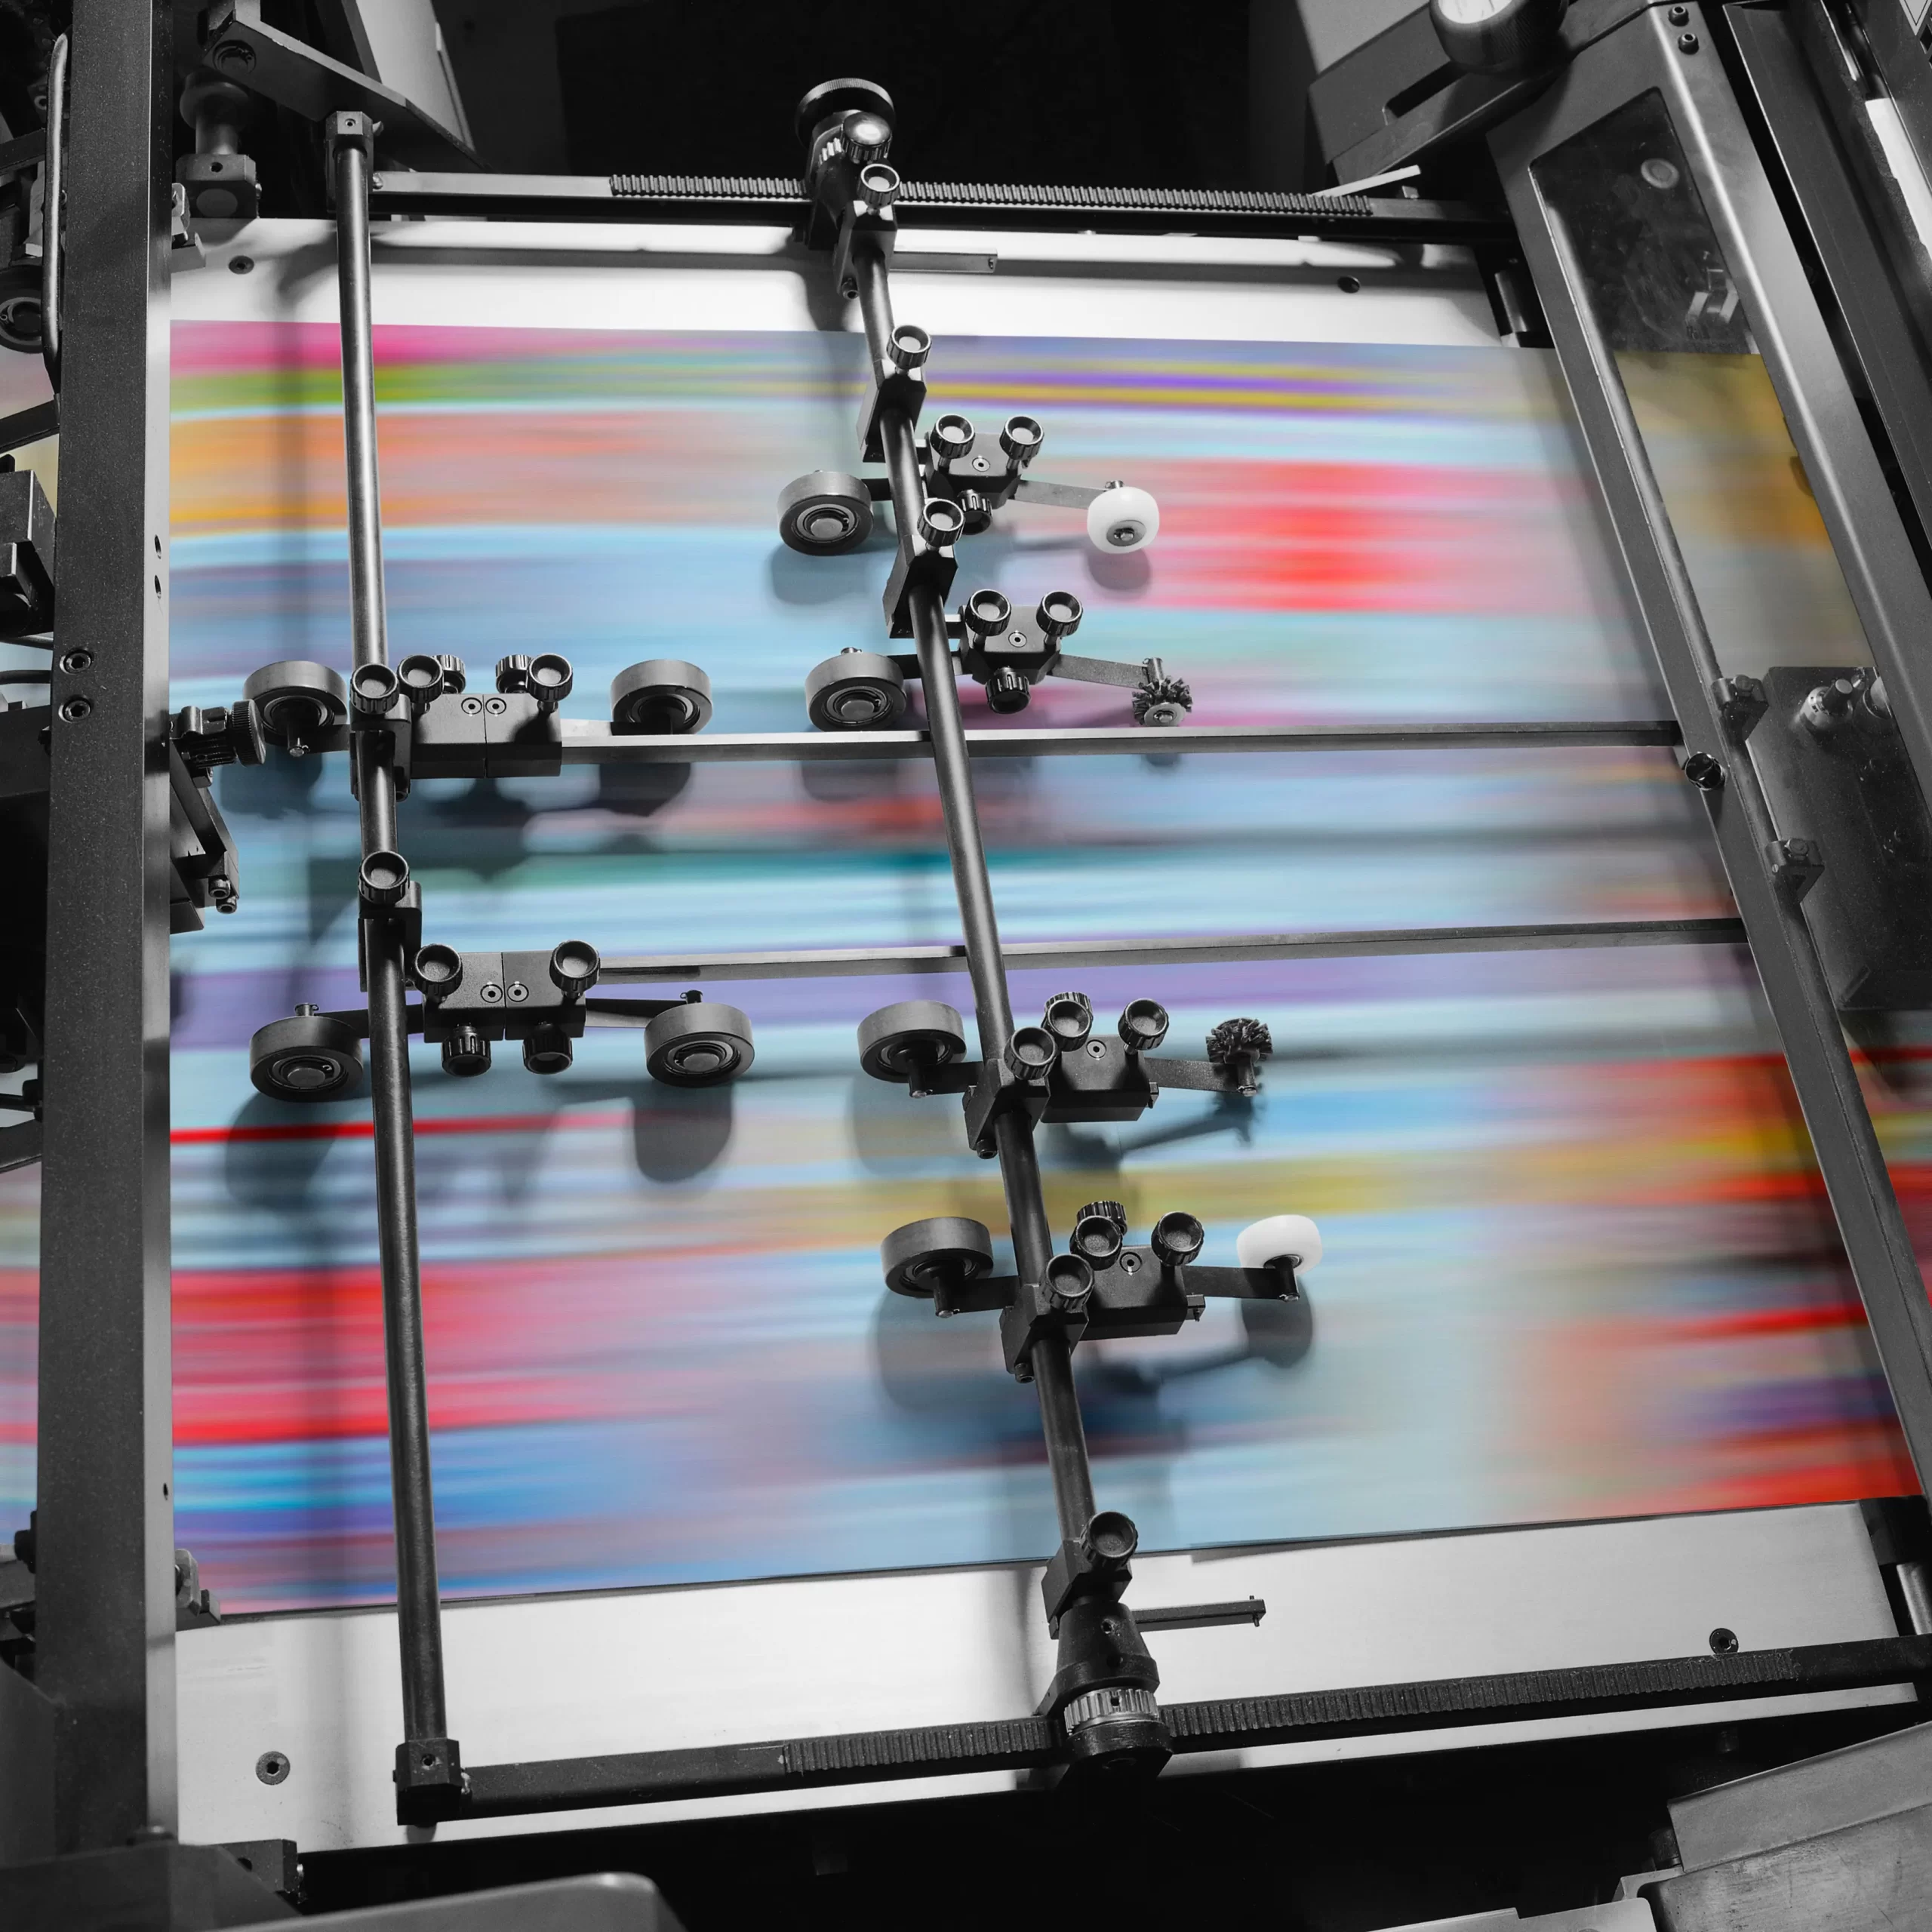
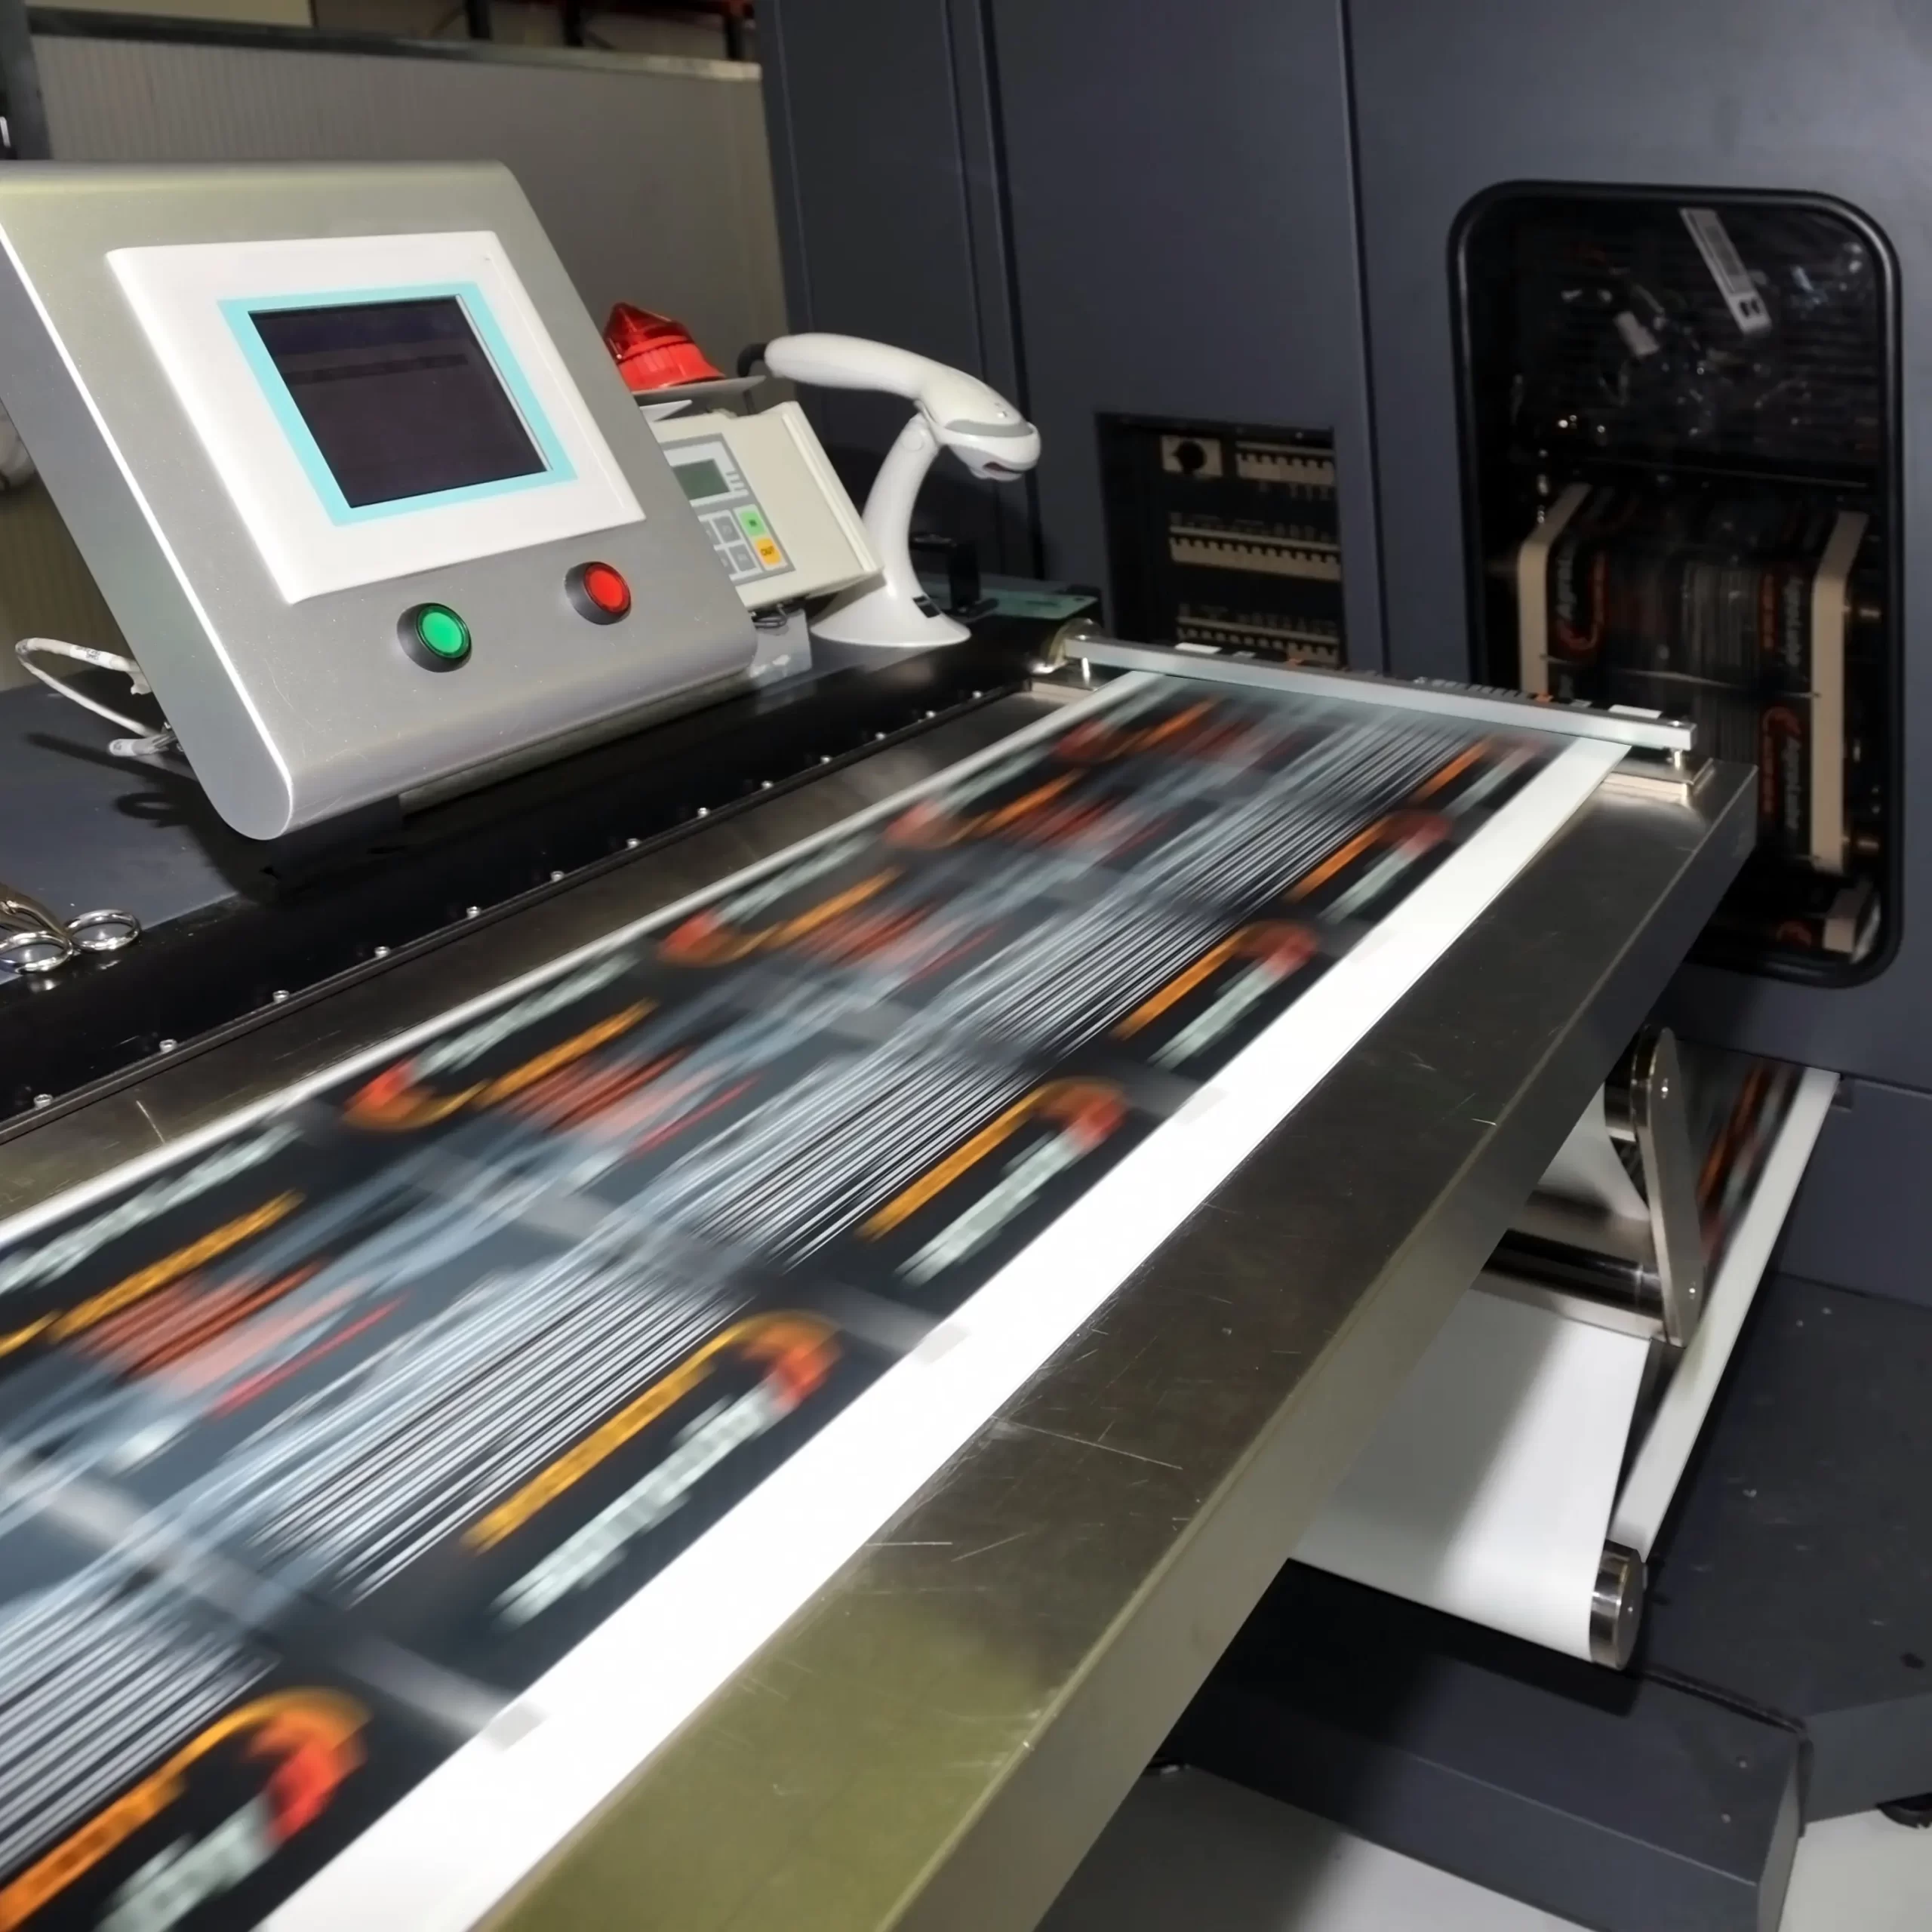
Print quality verification. What makes the difference.
Although (according to many) at first glance it is only a part of a relatively complex process of preparation for printing, and then the printing itself, the so-called THE PROOF and certification of the press is a delicate and important step in the Grape studio, the outcome of which, at the end of the day, depends on all the efforts made by designers and clients for weeks and often months. Many of our colleagues view the certification of the press as a passing, almost bureaucratic station in the process of placing visuals on the market. However, in our studio, print quality control and print certification is one of the most important and delicate aspects of work, and something we are known for in the industry.
Prominent professionals and university professors in the Grape studio are engaged in this work – doyens in the field. And that is exactly why Grape studio has become synonymous with quality and essential trust when it comes to print quality control. This is, after all, a practice that we are increasingly applying in our work in general – with us, details make a difference.
- Visual inspection
- Detection of defects in the print
- Verification of the accuracy of the content and logical verification in relation to the proof
- Direct check of color matching in relation to proof
- Check metamerism
- Densitometric measurements
- Measurement of optical density of full tone
- Measuring the tonal value of the raster
- Measuring the increase of raster tonal values
- Measure the relative contrast of the print
- Download color traping
- Measurement of gray balance
- Check for duplication, scrolling
- Check the range of reproduced tonal values
- Measurement of color deviation
- CIE XYZ – three-stimulus values
- CIE xyY – chromaticity coordinates
- CIE L * a * b * – values